 StatPi
The arithmetic, done. The thinking, yours.
It is midnight, the problem set is due, and the p-value on your screen has no reason behind it. The exam will ask for the reason. Type the numbers from your problem and StatPi writes out every step between the formula and the answer, with a plain note wherever a step needs a reason and the same answers R gives. You walk into the exam able to explain the step and knowing which test to use.
Works in your phone's browser. No account to make.
Below 0.05: significant at the 0.05 level.
See the step that would have tripped you up.
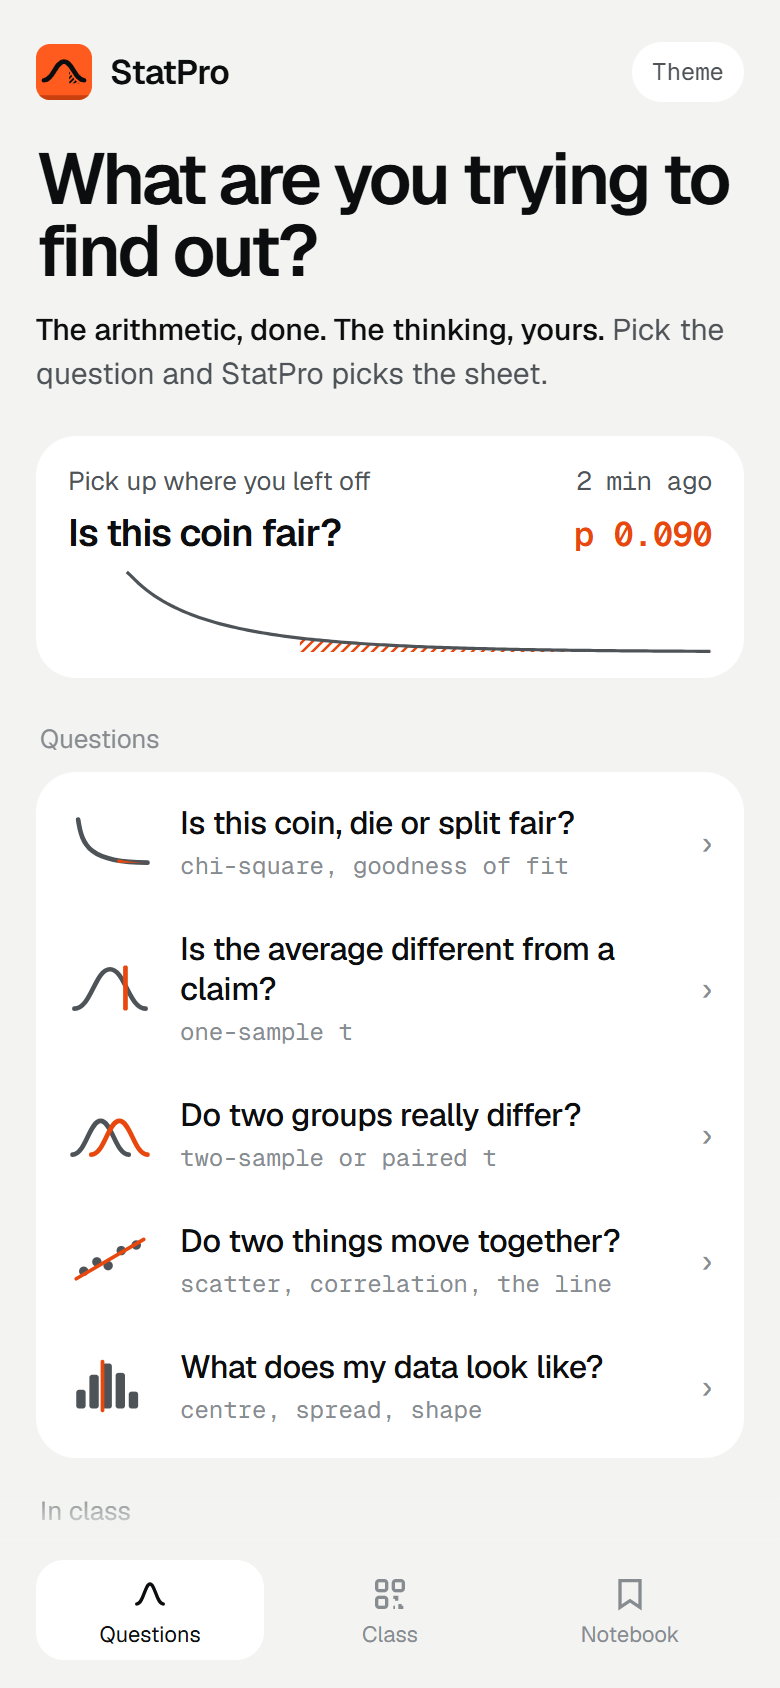
- Say what you are trying to find outHome asks the question in plain words first, the test name second. "Is this coin fair?" before "chi-square, goodness of fit."
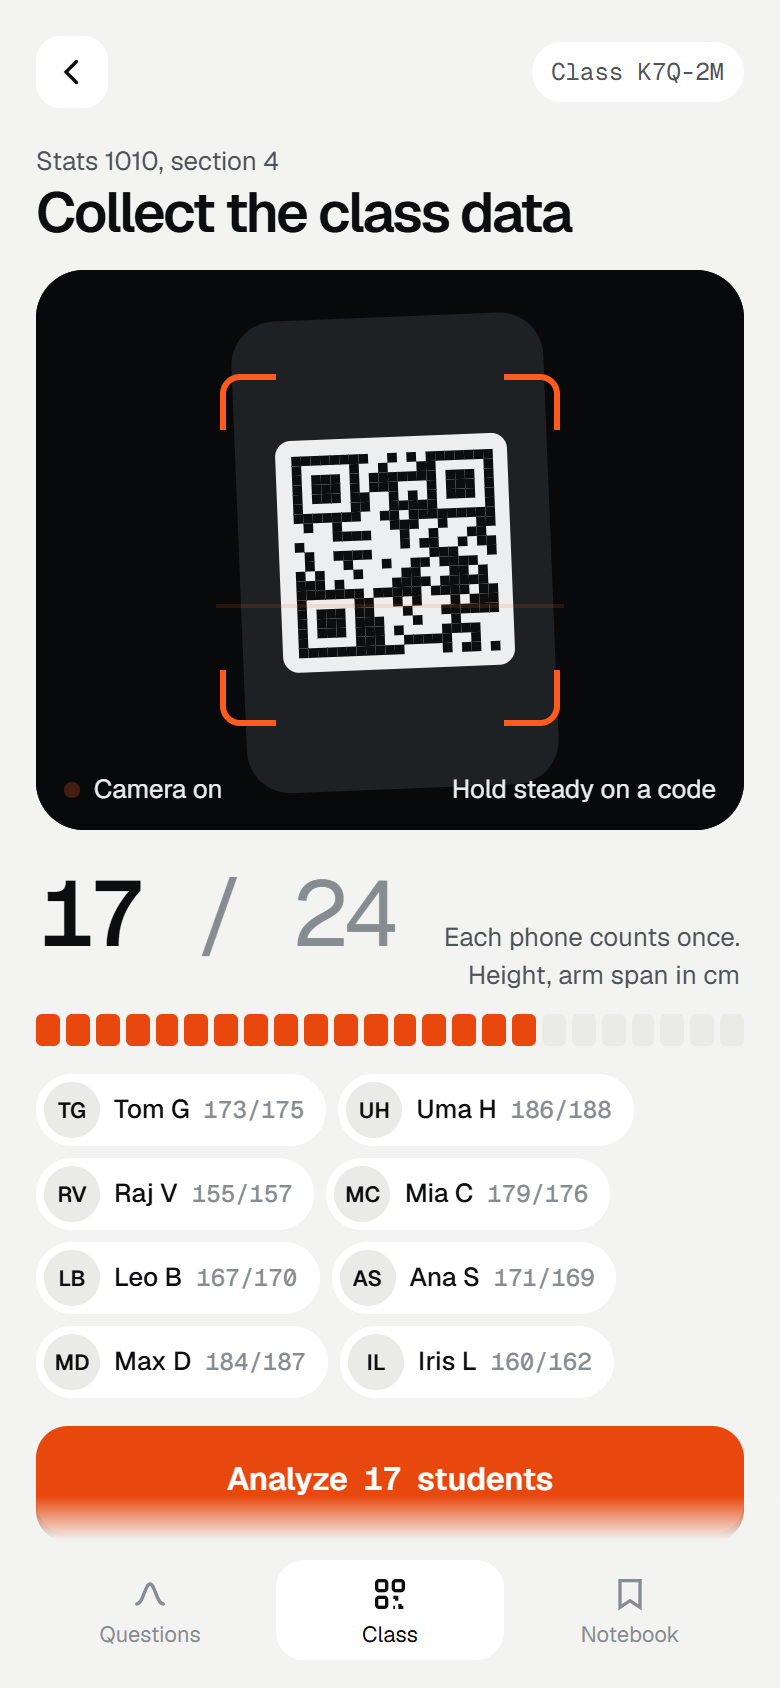
- Put your numbers inType them, paste a column, or join your class and send your data from your phone.
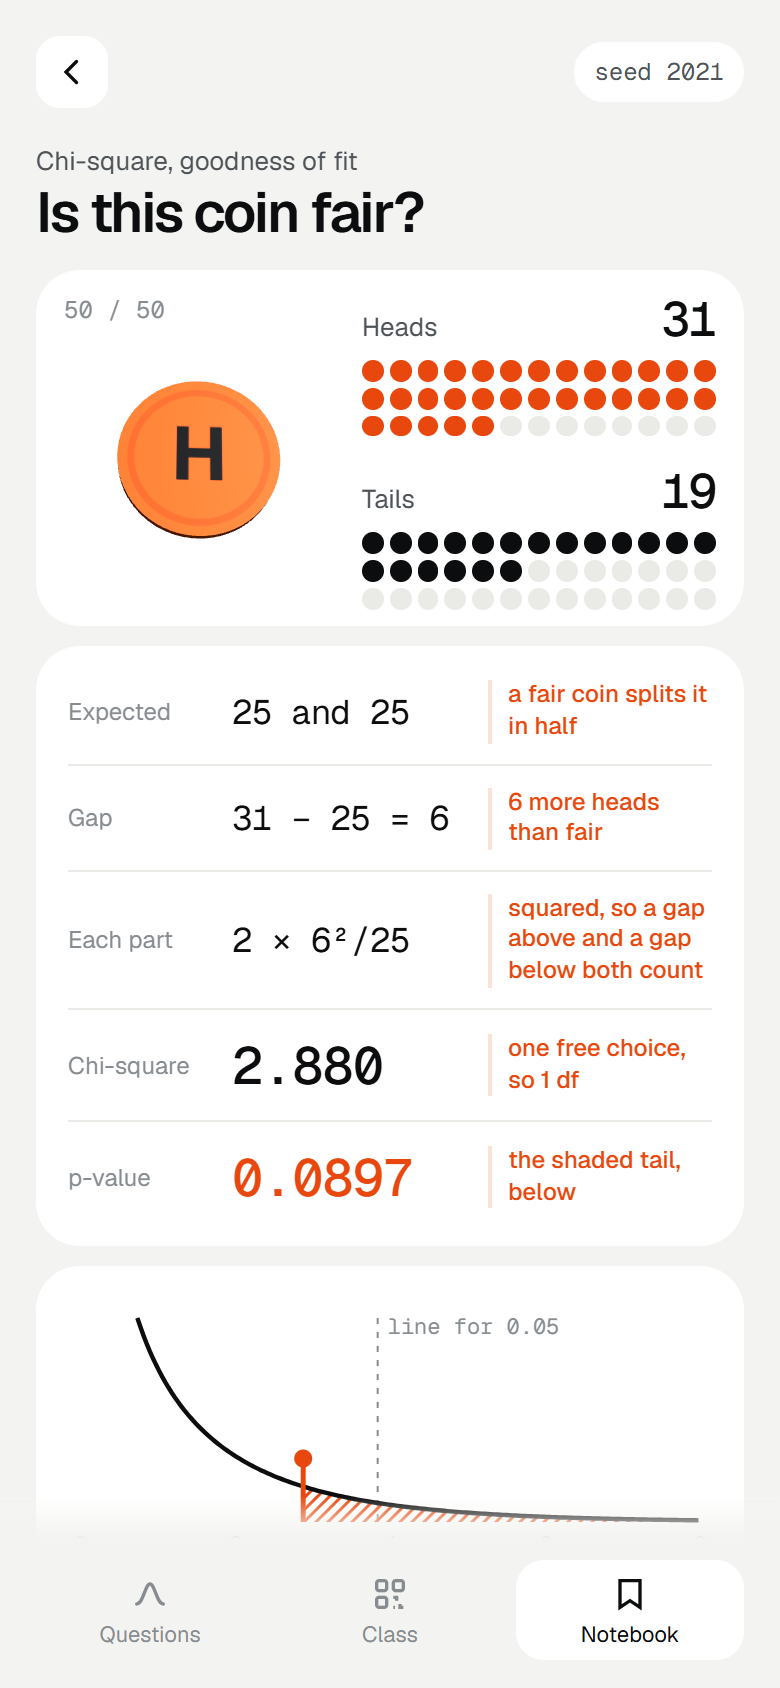
- Read the working, not just the answerEvery result carries its worked steps in a fixed-width column, the way you would write them on paper.
(31 − 25)² / 25 = 1.440
chi-square 2.880, df 1
p = 0.0897
Squared, so a gap above and a gap below both count.
Not significant at 0.05. At 0.10 it would be.
The class watches the concept form from its own data.
A distribution on a slide is somebody else's data, and the room drifts. When the numbers are theirs, students lean in.
Live class sessions
Start a session, show one code, and every phone in the room sends its number. The histogram builds bar by bar on your screen, and each student sees their own bar marked "You". No names, just where they sit. No wifi? Each phone shows a code you scan.
The working on the board
Put one result up for the room and talk through each step. The steps are the same ones your students see on their phones.

Built at the front of a room
The idea came from a statistics professor who taught intro biostatistics for more than twenty years: teach statistics, not how to be a statistician. Meet him.
Start free. Open the rest when your course gets there.
StatPi Lite
One variable: put it in, describe it, and work the binomial, Poisson and normal sheets.
Open LiteStatPi
The full edition, for when the course reaches tests and intervals: two variables, categories, the t, chi-square and F sheets, Bayes' rule, intervals and tests, ANOVA, and live class sessions. One purchase, no subscription.
See pricingTwo guides. You do the thinking.
A professor who taught this course for more than twenty years, and a builder who turned his way of teaching into the app on your phone.

Adam LaBare
Founder and CEO
Adam founded 2ndBrain Way, which builds the extra pair of hands a business is missing. He built StatPi with Paul so the step you are missing is on the screen, and he opens the room at Office Hours.
Dr. Paul Weiss, PhD
Co-founder and Chief Academic Officer
In statistics since 1993, and on the faculty of Emory University's Rollins School of Public Health from 2000 to 2023. The idea behind StatPi is his: teach statistics, not how to be a statistician. Meet him.
Adam and Paul are 50/50 partners. StatPi is part of the 2ndBrain Way network.
Finally see why every step is there.
Two hours of live statistics office hours with Professor Paul Weiss, PhD. Send the question you are stuck on and it may get worked on screen, step by step.